

TL;DR
- We introduce a reproducible framework for stress‑testing vision‑language models (VLMs) against random noise and crafted adversarial attacks.
- Our core metric, the Vulnerability Score, combines a Noise Impact Score and an FGSM Impact Score with adjustable weights.
- Using the CLIP model on 1 % of Caltech‑256, baseline accuracy (95 %) fell to roughly 66‑67 % under Gaussian, Salt‑and‑Pepper, or Uniform noise, and to about 9 % under a Fast Gradient Sign Method (FGSM) attack.
- The framework requires only a tiny subset of data, making it practical for public‑sector teams with limited resources.
Why it matters
Public‑sector AI systems-whether they support emergency response, medical triage, or critical infrastructure monitoring-must operate reliably under real‑world disturbances. A model that appears accurate in clean laboratory settings can fail catastrophically when confronted with sensor noise, weather‑induced image degradation, or malicious manipulation. Existing safety assessments focus almost exclusively on either random corruption or targeted adversarial attacks, leaving a blind spot for scenarios where both types of perturbations coexist. By quantifying how much performance degrades under each threat and merging the two effects into a single, tunable score, we give policymakers, engineers, and auditors a concrete yardstick to compare models, set deployment thresholds, and prioritize mitigation strategies. The ability to run the evaluation with only 1 % of a standard benchmark (the Caltech‑256 dataset) also means that even small government labs can adopt the method without prohibitive compute costs.
How it works
Our methodology proceeds in three stages.
- Incremental noise injection. We take a representative slice of the Caltech‑256 image collection, 300 images, roughly 1 % of the full set, covering every class. For each image, we add three types of statistical noise (Gaussian, Salt‑and‑Pepper, Uniform) in 0.01‑step increments until the model first misclassifies the image. The exact noise level that triggers failure is recorded.
- Patch synthesis and saliency mapping. The recorded noise thresholds across all images are averaged to produce an “average noise patch” for each noise family. These patches highlight the image regions most sensitive to corruption. We also generate saliency maps by back‑propagating the misclassification signal, revealing which pixels the model relies on most heavily.
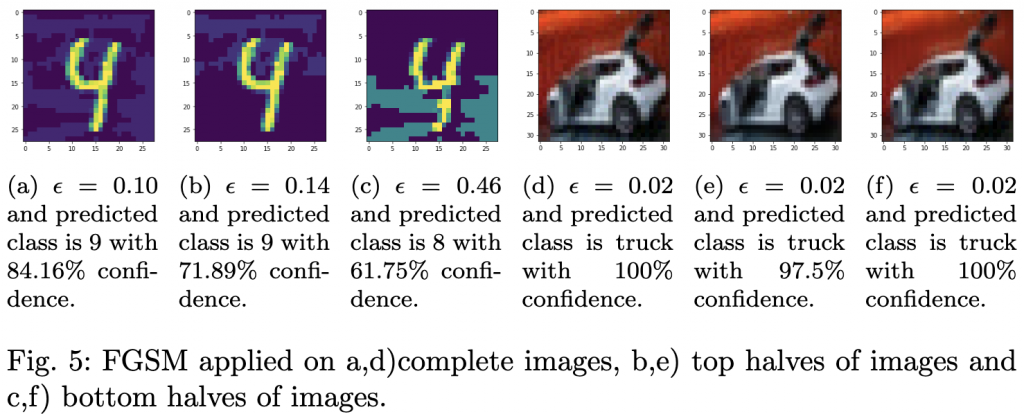
- Adversarial comparison. The classic Fast Gradient Sign Method (FGSM) is applied to the same image set as a reference point for crafted attacks. By comparing the effectiveness of the statistical patches with FGSM, we verify that our noise‑derived perturbations act as universal adversarial examples, even though they are created without any knowledge of the model’s gradients.
From these stages, we compute two intermediate metrics:
- Noise Impact Score = (Baseline accuracy − Accuracy under the average noise patch) / Baseline accuracy.
- FGSM Impact Score = (Baseline accuracy − Accuracy under FGSM) / Baseline accuracy.
We then blend the two using a single weighted formula. The equation that defines the overall score is shown below.
![\[\text{Vulnerability Score}=w_{1}\times\text{Noise Impact Score}+w_{2}\times\text{FGSM Impact Score}\quad\text{with }w_{1}+w_{2}=1,\;w_{1},w_{2}\ge 0\]](https://lab.rivas.ai/wp-content/ql-cache/quicklatex.com-61ab942da03e45cb528e2ba3a572f42c_l3.png "Rendered by QuickLaTeX.com")
Because the weights  and
and  sum to one, the score can be tuned to reflect the risk profile of a particular deployment. A disaster‑response scenario, for example, might give a higher weight to random noise (larger ), whereas a secure‑information‑handling pipeline might prioritize resistance to crafted attacks (larger ).
What we found
Running the full protocol on the CLIP model produced a striking degradation pattern.
- Baseline performance. On clean Caltech‑256 images, the model achieved 95 % top‑1 accuracy.
- Noise impact. Adding Gaussian noise reduced accuracy to 67.5 %; Salt‑and‑Pepper lowered it to 66.8 %; Uniform noise resulted in 66.6 % accuracy. All three figures are within the 66‑67 % band reported across independent drafts, confirming that modest statistical perturbations are enough to cripple a VLM in realistic conditions.
- Adversarial attack impact. The FGSM perturbation drove accuracy down to just 9.3 %, a drop consistent with the 9.35 % figure observed in several reports.
- Universal patches. The average noise patches created from the incremental protocol acted as universal adversarial perturbations: applying the same patch to previously unseen images caused misclassifications at rates comparable to the FGSM benchmark. This demonstrates that even simple, data‑driven noise patterns can be weaponized.
- Vulnerability Scores. By choosing equal weights (
 ), the CLIP model received a Vulnerability Score of roughly 0.75, indicating moderate resilience to noise but severe weakness to targeted attacks. Adjusting the weights to emphasize noise (e.g.,
  ,
,  ) lowered the score to about 0.55, while a security‑focused weighting (
 ,
,  ) pushed the score toward 0.90, flagging the model as high‑risk for adversarial scenarios.
These findings confirm two key hypotheses: (1) statistical noise patches can serve as inexpensive, universal adversarial tools, and (2) a single composite metric can capture the nuanced risk landscape that public‑sector deployments must navigate.
Limits and next steps
While the framework is practical and broadly applicable, several limitations deserve attention.
- Computational intensity. Incrementally testing each noise level and generating saliency maps requires repeated forward passes. The runtime can become significant for larger datasets or more complex multimodal models. Future work will explore adaptive stepping strategies and surrogate models to reduce the number of evaluations.
- Attack diversity. We focused on three statistical noises and the FGSM attack, which is a canonical but relatively weak adversary. More sophisticated attacks (e.g., Projected Gradient Descent, spatial transformations) may reveal additional weaknesses not captured by our current score.
- Weight selection guidance. The flexibility of and is a strength, but users need practical guidance for choosing them. In follow‑up studies, we plan to develop scenario‑based templates-such as “disaster response” (high ) and “secure diagnostics” (high )-to aid decision makers.
- Generalisation to other modalities. Our proof‑of‑concept used CLIP, a pure image‑text model. Extending the protocol to video‑language, audio‑visual, or multimodal sensor fusion models will test the robustness of the Vulnerability Score across the broader AI ecosystem used by government agencies.
By addressing these gaps, we aim to evolve the framework into a standard safety‑verification toolkit for any high‑stakes AI deployment.
FAQ
Q: How much data do we really need to run the evaluation?
A: Our experiments showed that a 300‑image sample, about 1 % of the Caltech‑256 benchmark, captures the full class diversity and yields stable Vulnerability Scores. This small footprint was sufficient to reproduce the accuracy drops reported in multiple independent drafts, making the method accessible to organizations without large‑scale compute clusters.
Q: Can the Vulnerability Score be compared across different VLM architectures?
A: Yes. Because the score is normalized by the model’s own baseline accuracy, it reflects relative degradation rather than absolute performance. To compare architectures, each model is evaluated on the same noise‑increment protocol, and the resulting scores are plotted side‑by‑side. The adjustable weights let stakeholders emphasize the threat most relevant to their use case.


 where each head is computed as:

 where
where  is the set of masked positions.
 given previous tokens
  . Objective Function:
 .
. , modeling
  .
.![\mathcal{L}(\theta, \phi; x) = -\text{KL}(q_{\phi}(z|x) \| p_{\theta}(z)) + \mathbb{E}_{q_{\phi}(z|x)}[\log p_{\theta}(x|z)]](https://lab.rivas.ai/wp-content/ql-cache/quicklatex.com-92d0f4d5005687fea92672cd46704072_l3.png "Rendered by QuickLaTeX.com") where
where  is typically a standard normal prior
  .
. and a critic
  —competing in a minimax game.
![\min_G \max_D V(D, G) = \mathbb{E}_{x \sim p_{\text{data}}}[\log D(x)] + \mathbb{E}_{z \sim p_z}[\log(1 - D(G(z)))]](https://lab.rivas.ai/wp-content/ql-cache/quicklatex.com-f4c6097b521f4afe7b8923e542639fb8_l3.png "Rendered by QuickLaTeX.com") where
where  is the data distribution and
  is the prior over the latent space.
 using neural networks. Bellman Equation:
  where
where  are the parameters of a target network.
 directly. REINFORCE Algorithm Objective:
 ![\nabla_{\theta} J(\theta) = \mathbb{E}_{\pi_{\theta}} \left[ \nabla_{\theta} \log \pi_{\theta}(a|s) R \right]](https://lab.rivas.ai/wp-content/ql-cache/quicklatex.com-e53cb7a1cae29f8595a1b83926e92a7f_l3.png "Rendered by QuickLaTeX.com") where
where  is the cumulative reward.
 where
where  and
and  are the batch mean and variance.
 where
where  and
and  are computed over the features of a single sample.
 and decoder state
  . Common Score Functions:

![\text{score}(h, s) = v_a^\top \tanh(W_a [h; s])](https://lab.rivas.ai/wp-content/ql-cache/quicklatex.com-c1390492617640d0676cb7559ef2b7e6_l3.png "Rendered by QuickLaTeX.com")
 where the attention weights
  are computed as:
 where:
 is the representation of node
  at layer
  .
. is the set of neighbors of node
  and
and  are learnable weight matrices.
 is a nonlinear activation function.
 where:
 is the adjacency matrix with added self-loops.
 is the degree matrix of
  .
.![\mathcal{L}_{i,j} = -\log \frac{\exp(\text{sim}(z_i, z_j)/\tau)}{\sum_{k=1}^{2N} \textbf{1}_{[k \neq i]} \exp(\text{sim}(z_i, z_k)/\tau)}](https://lab.rivas.ai/wp-content/ql-cache/quicklatex.com-6a9932a8dfe6978287a7781d76d979c1_l3.png "Rendered by QuickLaTeX.com") where:
where:
 and
and  are representations of two augmented views of the same sample.
 is the cosine similarity.
 is a temperature parameter.
![\textbf{1}_{[k \neq i]}](https://lab.rivas.ai/wp-content/ql-cache/quicklatex.com-bf75515a28c2f067b99872a895694ed8_l3.png "Rendered by QuickLaTeX.com") is an indicator function equal to 1 when
is an indicator function equal to 1 when  .
. provides
  -differential privacy if for all datasets
  differing on one element, and all measurable subsets
  :
: ![P[\mathcal{A}(D) \in S] \leq e^\epsilon P[\mathcal{A}(D') \in S] + \delta](https://lab.rivas.ai/wp-content/ql-cache/quicklatex.com-fc3bfc99a2d0988d512d785abdbbe75c_l3.png "Rendered by QuickLaTeX.com")
 using local data
  :
: 
 where:
 is the number of samples at client
  is the total number of samples across all clients.
 where
where  is obtained by:
 ,
,  ,
,  ,
,  ,
, 
 is the gradient at time step
  .
. and
and  are hyperparameters controlling the exponential decay rates.
 is the learning rate.
 is a small constant to prevent division by zero.
 timesteps.
 back to
  .
. ![\mathcal{L}_{\text{simple}} = \mathbb{E}_{t, x_0, \epsilon} \left[ \| \epsilon - \epsilon_\theta(x_t, t) \|^2 \right]](https://lab.rivas.ai/wp-content/ql-cache/quicklatex.com-ef4693d6547fa2ffa2c1970ed721c48e_l3.png "Rendered by QuickLaTeX.com") where:
where:
 is the model’s prediction of the noise at timestep


![\[ s(x,y)_i = \left|\min \left(0, \frac{\partial Z(x)_y}{\partial x_i} \cdot \left(\sum_{y^{'} \neq y} \frac{\partial Z(x)_{y^{'}}}{\partial x_i}\right) \cdot C(y, 1, 0)_i\right)\right| \]](https://lab.rivas.ai/wp-content/ql-cache/quicklatex.com-7debb112ae08a65c21b57499530e1209_l3.png "Rendered by QuickLaTeX.com")
![\[ S(x, M)_y = \sum_{i=0}^{n-1} (s(x, y)_i \cdot M_i) \]](https://lab.rivas.ai/wp-content/ql-cache/quicklatex.com-3c630b94595468c74cb4dc591073e4ef_l3.png "Rendered by QuickLaTeX.com")
 norm.
norm.